Social Media Analytics for Small Businesses: Metrics That Actually Matter
Social media dashboards can show dozens of numbers. The problem is that more numbers do not always create better decisions. A small business does not need to track every metric on every platform. It needs to track the few signals that connect content to a real goal.
If your goal is awareness, reach and video discovery may matter. If your goal is website traffic, outbound clicks matter more. If your goal is lead generation, messages, forms, calls, and qualified inquiries matter most.
This guide explains how to read social media analytics in a practical way. You will learn which metrics matter, how to compare posts fairly, how to connect social traffic to website actions, and how to run a useful monthly review.
1. Start With the Business Goal
Analytics should answer a question. Start with the goal before opening any dashboard.
Common goals
- Increase local awareness.
- Bring more people to the website.
- Generate leads or bookings.
- Increase product interest and sales.
- Build an email list.
- Improve customer support and trust.
Each goal needs a different metric set. Tracking only likes can hide whether the social activity supports the business.
2. Separate Vanity Metrics From Decision Metrics
A vanity metric looks impressive but does not tell you what to do next. A decision metric helps you change content, budget, or strategy.
Follower count can be useful as context. It becomes less useful when treated as proof of business growth.
| Metric | Useful question |
|---|---|
| Followers | Is the relevant audience growing over time? |
| Reach | How many people saw the content? |
| Saves | Was the content useful enough to keep? |
| Shares | Was it useful enough to pass to someone else? |
| Website clicks | Did the post move users to a deeper destination? |
| Leads | Did social activity create qualified business action? |
3. Understand Reach and Impressions
Reach usually refers to the number of unique accounts that saw content. Impressions generally count how many times content was displayed. Platform definitions can vary, so check current documentation.
Use reach to judge distribution. Use impressions to understand repeated exposure. Neither metric proves that people paid attention.
When reach matters
Reach is useful when your goal is discovery. Compare it with engagement, profile visits, or video watch data to see whether the content also created interest.
4. Track Engagement by Type
Not all engagement means the same thing. A like is a light action. A save can signal utility. A share can signal relevance. A detailed comment may show strong interest.
Break engagement into types when possible. Do not combine everything into one rate and assume all actions have equal value.
Example
A “monthly bookkeeping checklist” post may get fewer likes than a team photo but more saves and website clicks. If the goal is useful educational traffic, the checklist may be the stronger post.
5. Use Engagement Rate Carefully
Engagement rate can be calculated in different ways, such as engagement divided by reach, impressions, or followers. Use one method consistently when comparing your own posts.
Do not compare your engagement rate directly with a competitor unless you know the calculation and data source are the same.
6. Track Video Watch Quality
Video views can be misleading if people leave quickly. Look at watch time, completion rate, and retention when the platform provides them.
What retention can tell you
- Early drop: the opening may be slow or unclear.
- Drop after a specific point: the explanation may lose focus.
- Strong completion: the topic and pacing may fit.
- Rewatches: the content may be useful, dense, or entertaining.
Use retention to improve future scripts.
7. Track Profile Visits
A profile visit shows that a post created enough interest for someone to learn more. It sits between content discovery and deeper action.
If profile visits rise but website clicks remain low, check the bio, profile links, pinned content, and page clarity.
8. Measure Outbound Clicks
Outbound clicks matter when social content is meant to send users to your website, shop, booking page, or resource.
Match the post to the landing page. A post about Google Search Console should link to the Search Console guide, not a generic homepage.
9. Use UTM Parameters
UTM parameters help analytics tools identify where traffic came from. A simple naming system can include source, medium, campaign, and optional content labels.
For example, you might use the platform as source, “social” as medium, and a campaign name such as “local-seo-guide.” Keep naming consistent.
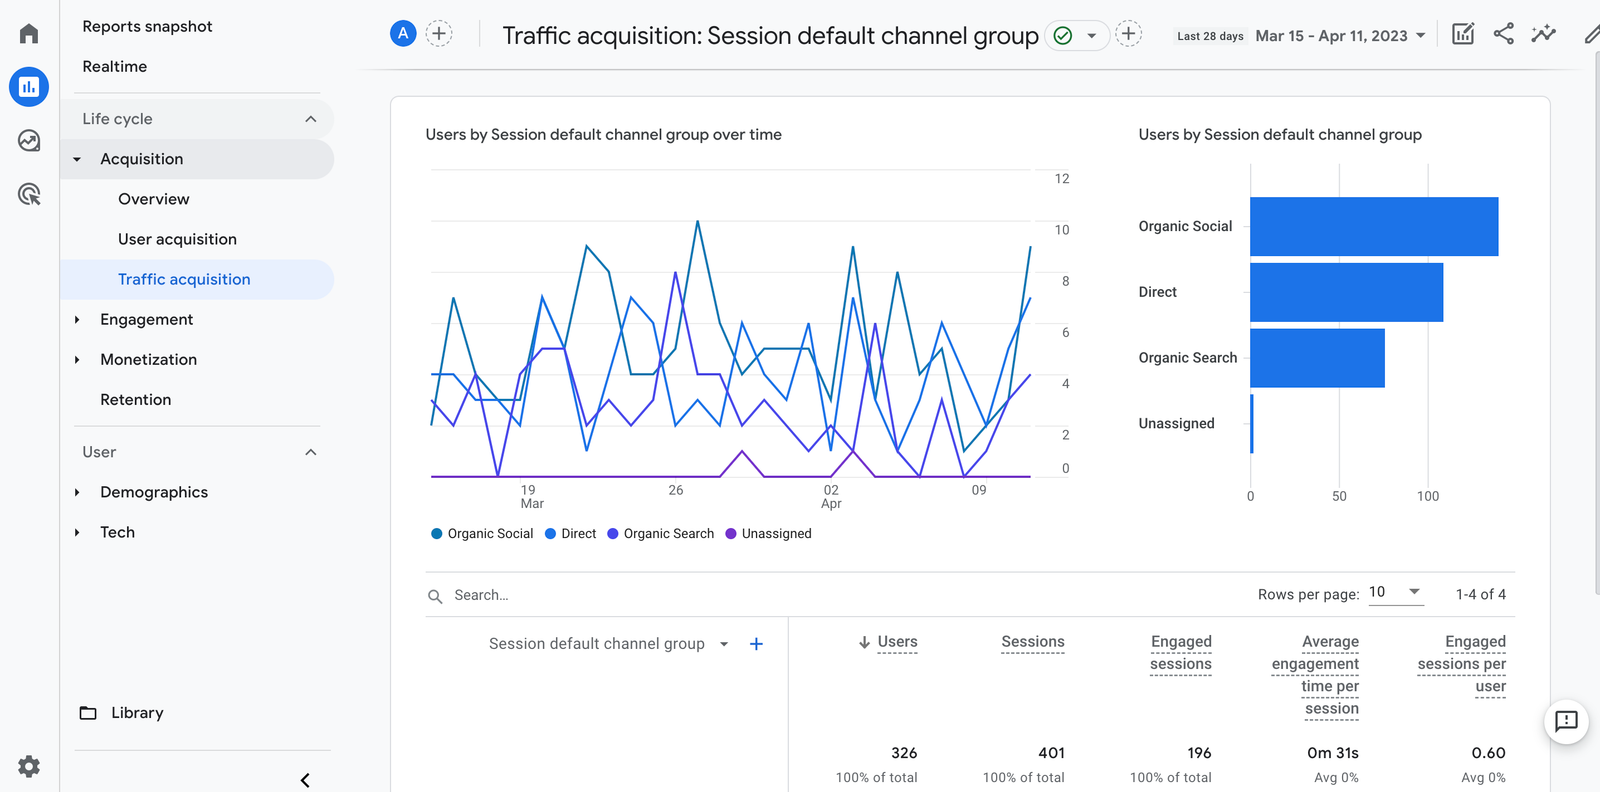
Use Google Analytics or your preferred analytics platform to review website behavior after the social click.
10. Connect Social Metrics to Website Behavior
A social dashboard shows what happened on the platform. Website analytics shows what happened after the click.
Review:
- Landing page visits
- Engaged sessions
- Key page views
- Form starts
- Form completions
- Purchases
- Email signups
- Internal page paths
This prevents you from judging traffic quality only by click count.
11. Track Leads by Source
If leads matter, record where they came from. Forms can include hidden source fields. Booking tools may store referral data. Sales staff can ask how the customer found the business.
Perfect attribution is difficult, but consistent tracking is better than guessing.
Use qualified leads, not raw leads
Ten spam messages are not better than three qualified inquiries. Define what makes a lead useful for your business.
12. Measure Conversion Rate
Conversion rate shows the share of users who completed a desired action. You can calculate it for website visitors, landing page sessions, or campaign clicks depending on your setup.
Example: if 200 social visitors reach a booking page and 10 complete a booking, the conversion rate is 5%.
Use the same definition each month so comparisons remain fair.
13. Track Cost Only When Paid Promotion Is Involved
Organic social still has a cost in staff time, tools, and production, but paid campaigns add direct media costs.
For paid social, watch cost per click, cost per lead, cost per purchase, and return on ad spend where appropriate. Use official resources such as Meta for Business for current campaign reporting details.
14. Compare Posts by Content Pillar
One post can be an outlier. Group content by pillar to see patterns.
Example pillars
- Education
- Customer proof
- Product demos
- Behind the scenes
- Offers
Compare which pillars create saves, shares, clicks, leads, and sales. This helps you decide what to produce next month.
15. Compare Formats Separately
A short video and a link post have different jobs. Compare similar formats before drawing conclusions.
If short videos create reach while carousels create saves, both may be useful. The strategy can use each format for a different stage of the customer journey.
16. Use a Content Efficiency Metric
Small teams should also track effort. A video that takes six hours to produce may not be worth a small increase in reach.
Add a simple production-time estimate to your review. Compare results per hour of work.
Example
One highly edited video takes four hours and creates 20 website clicks. A simple FAQ video takes 30 minutes and creates 18 clicks. The simple format may be easier to scale.
17. Track Comments for Research
Comments are not only engagement. They are market research. Record repeated questions, objections, and requests.
A strong comment can become a new post, FAQ, product update, or website section.
18. Measure Saves and Shares as Utility Signals
Saves often show that people want to return to the content. Shares may show that the content is useful to someone else.
Check which topics earn these actions. Checklists, templates, comparisons, and practical steps often perform well because they are easy to use later.
19. Track Branded Search Over Time
Social media can increase brand awareness even when users do not click directly. Some people may later search for your business name.
Google Search Console can help you observe branded search trends. Do not claim perfect attribution, but use the trend as supporting evidence.
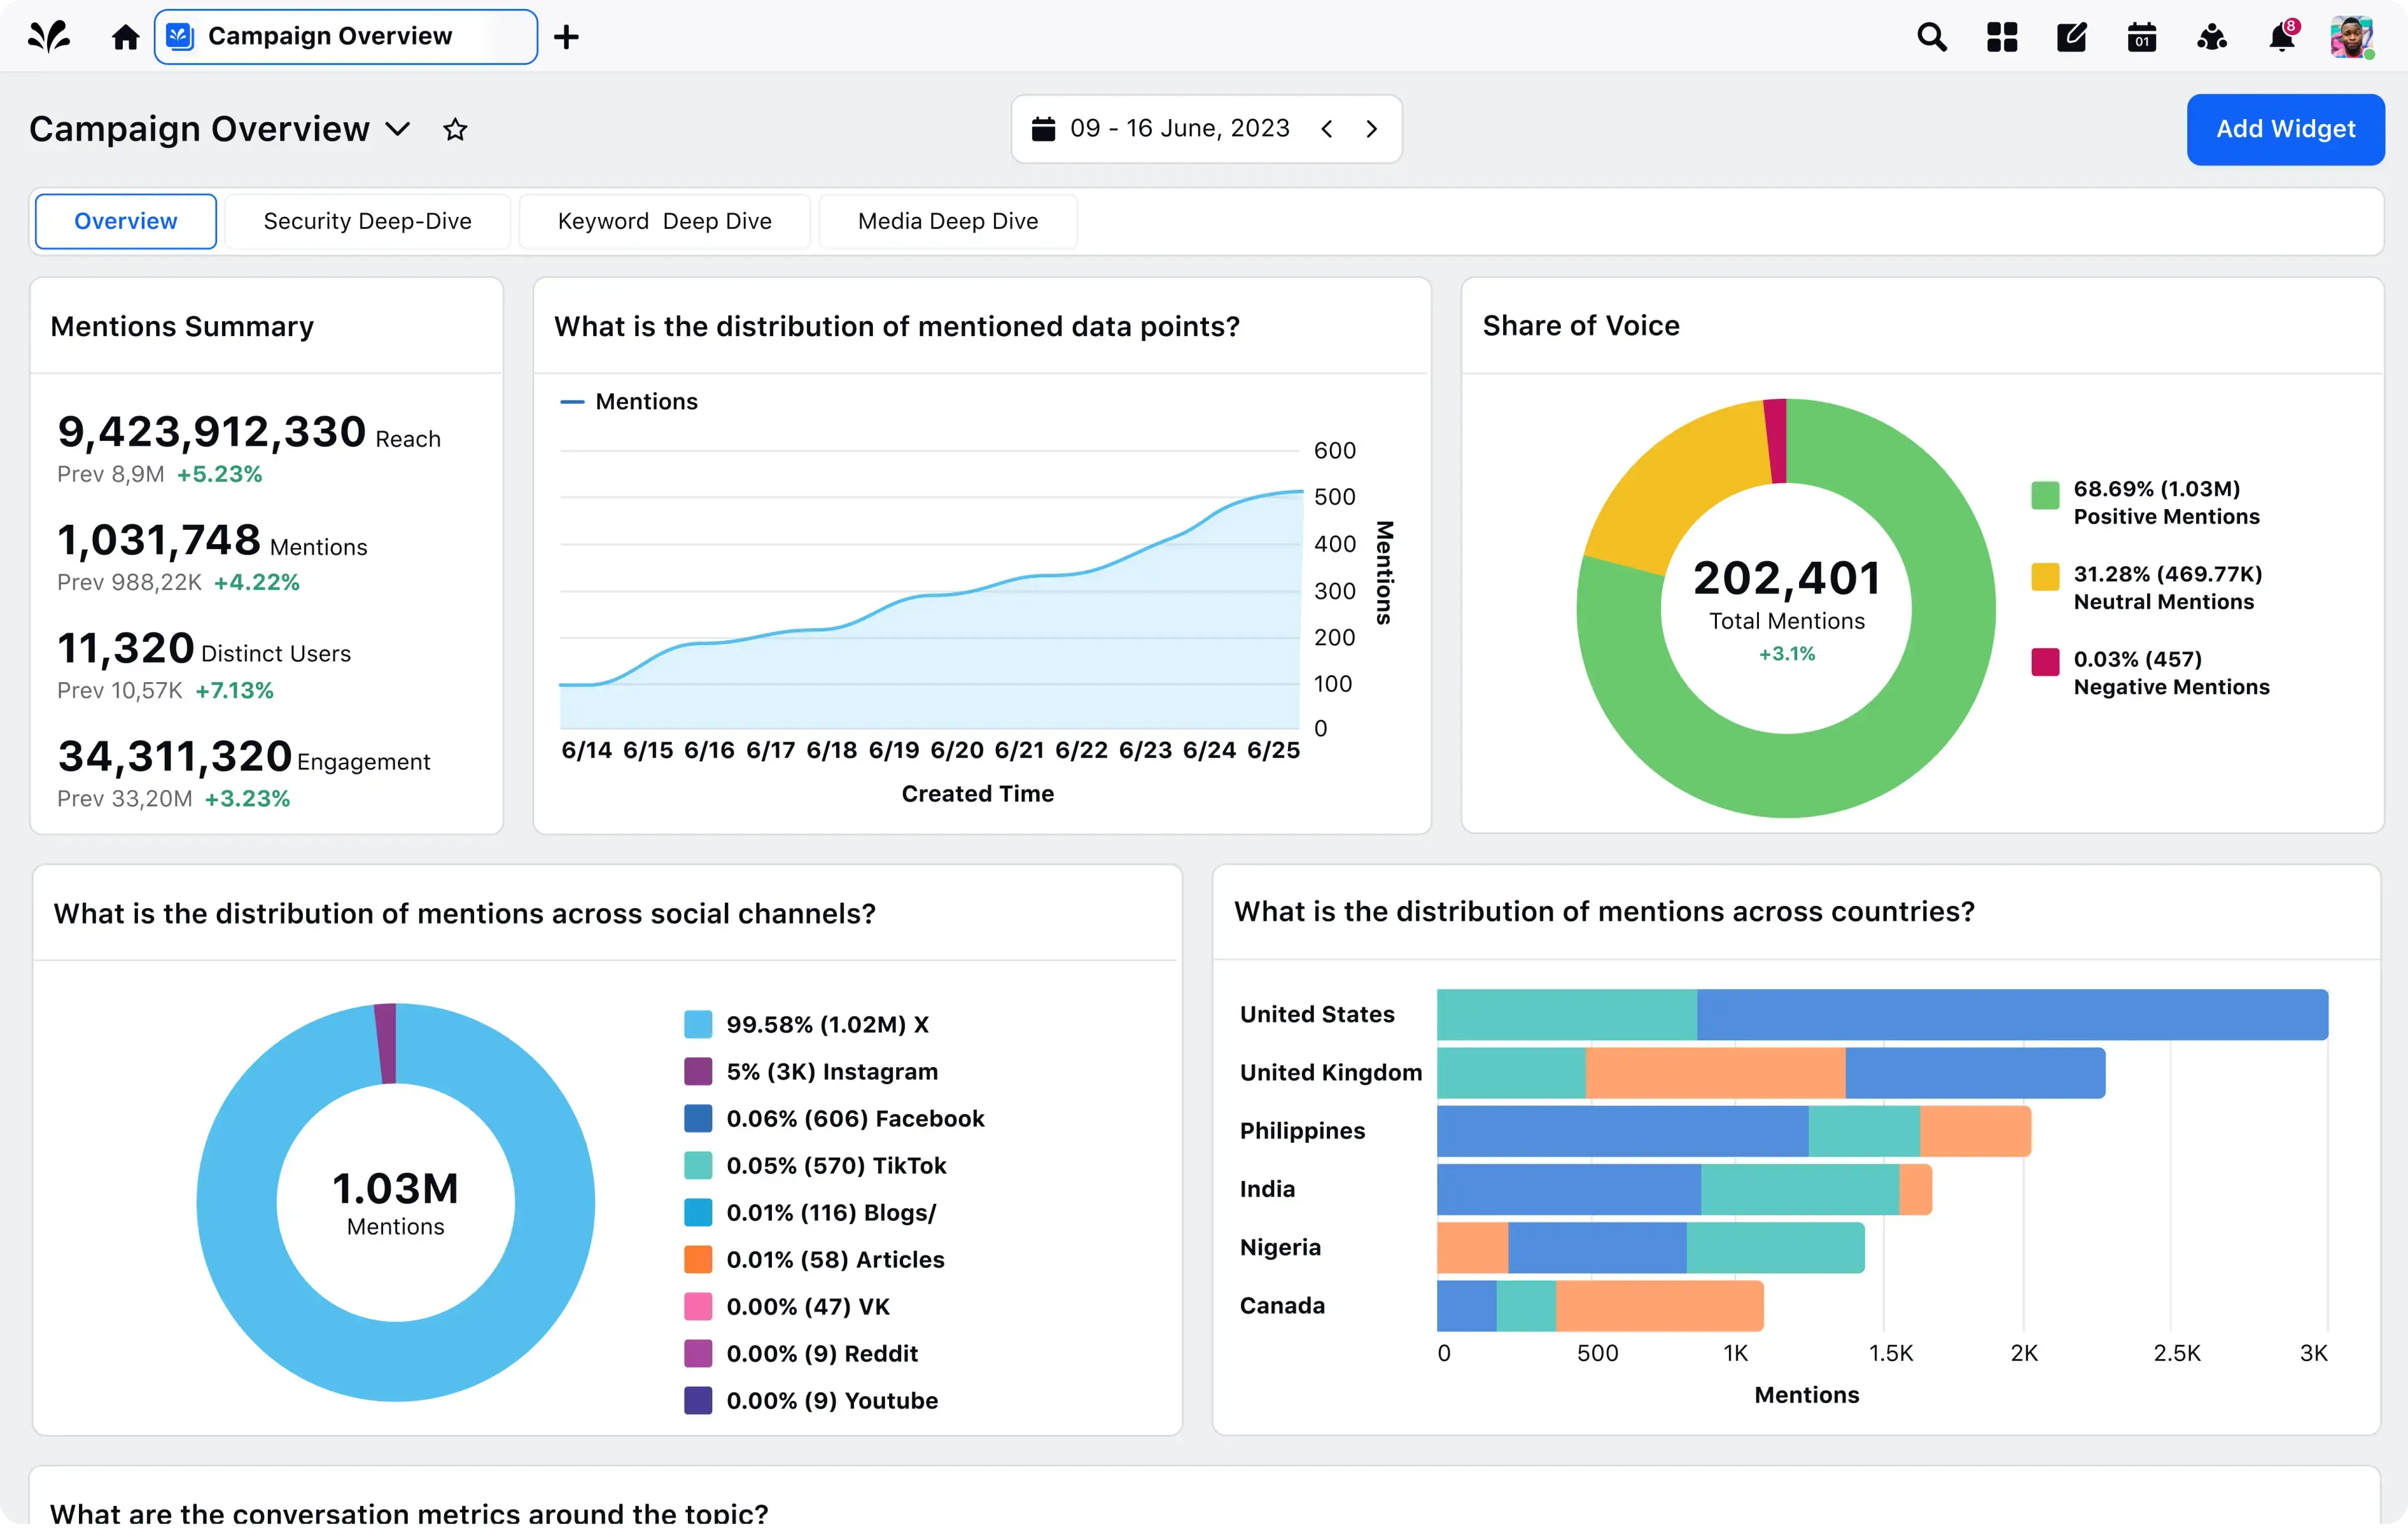
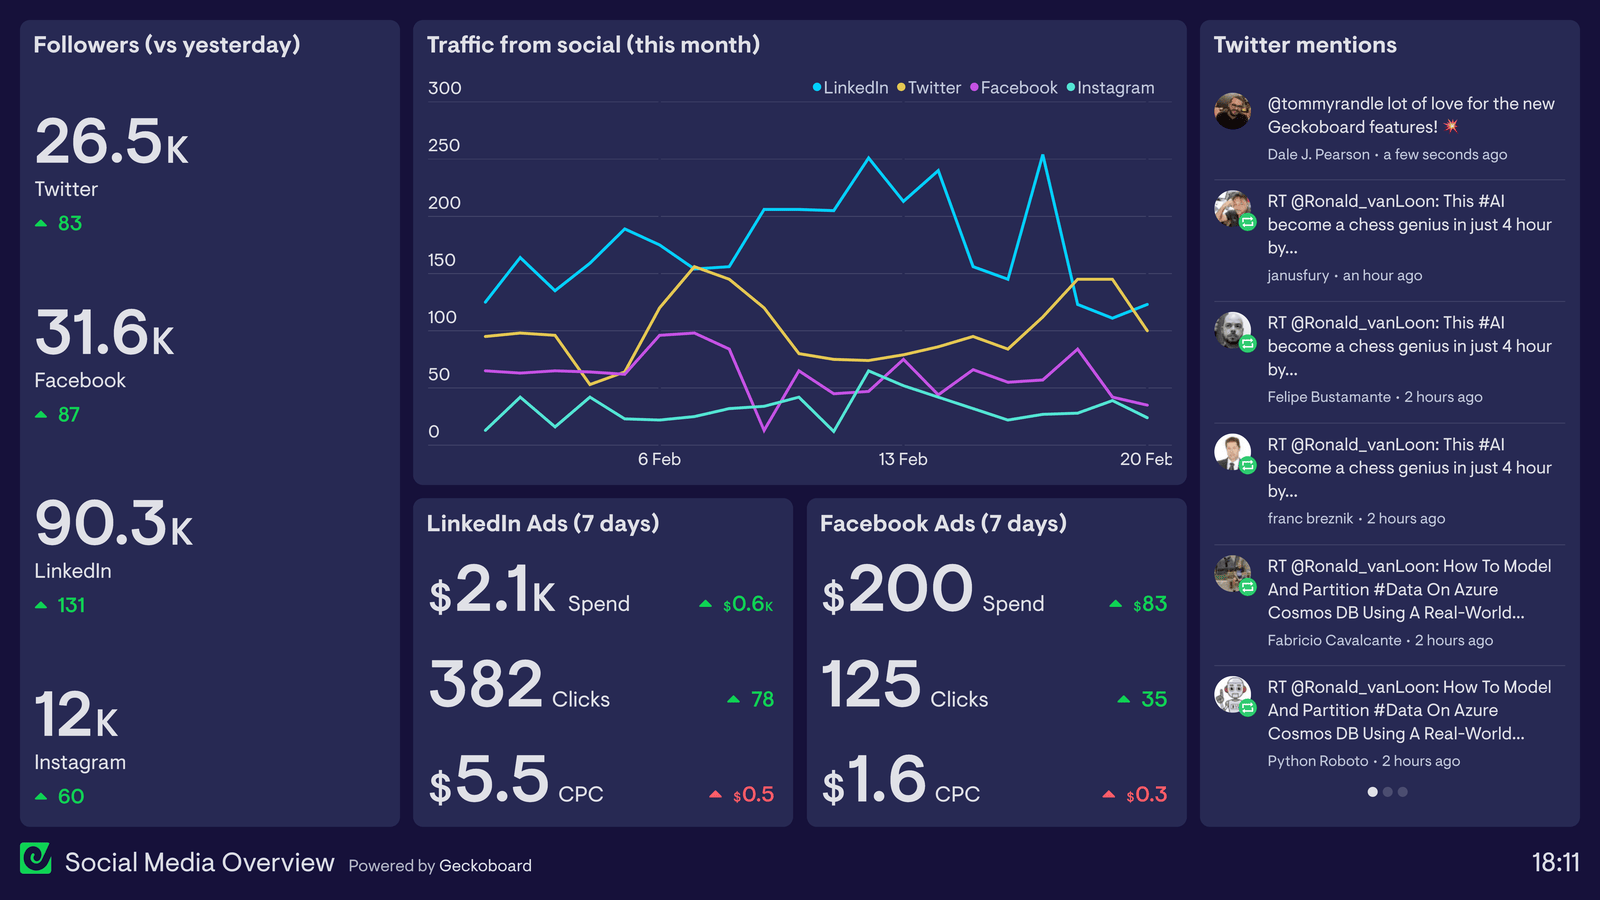
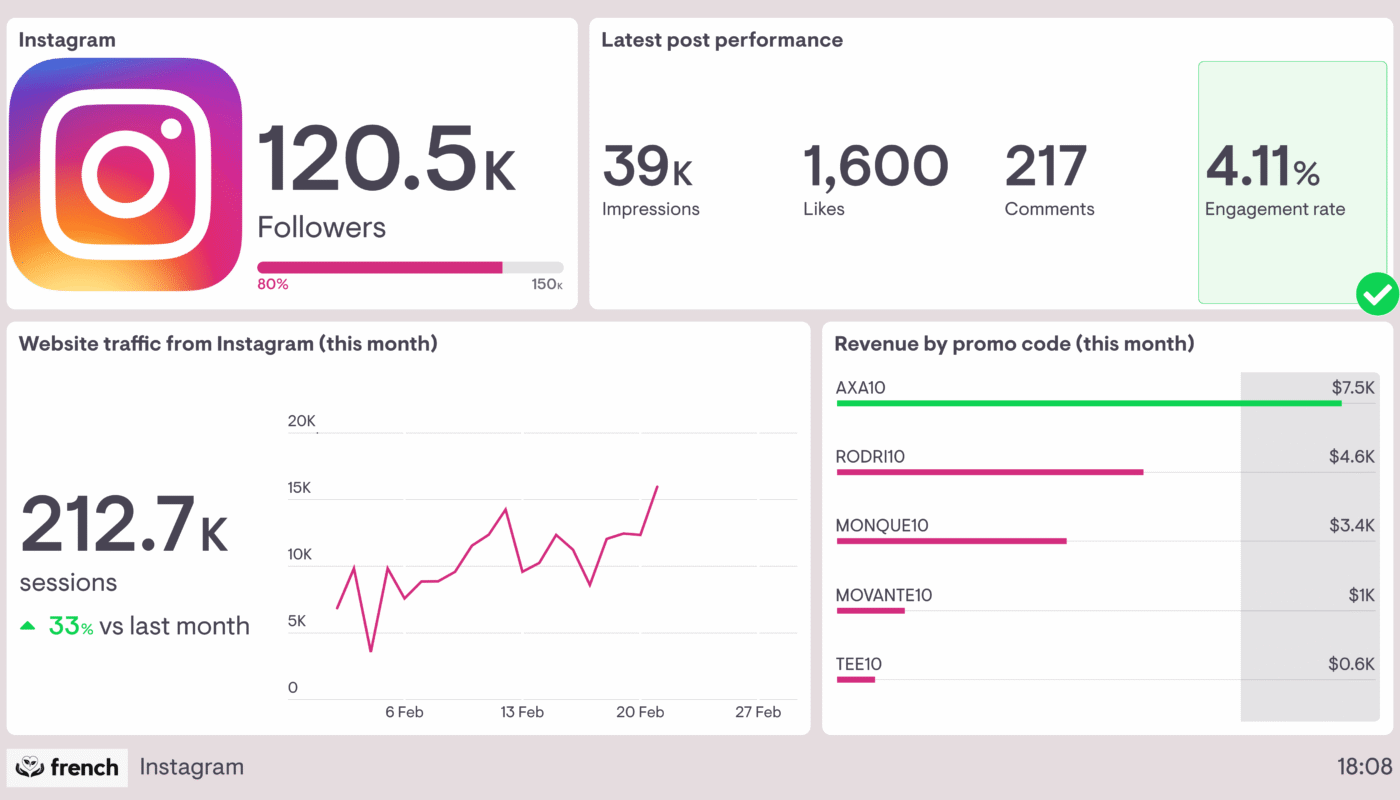
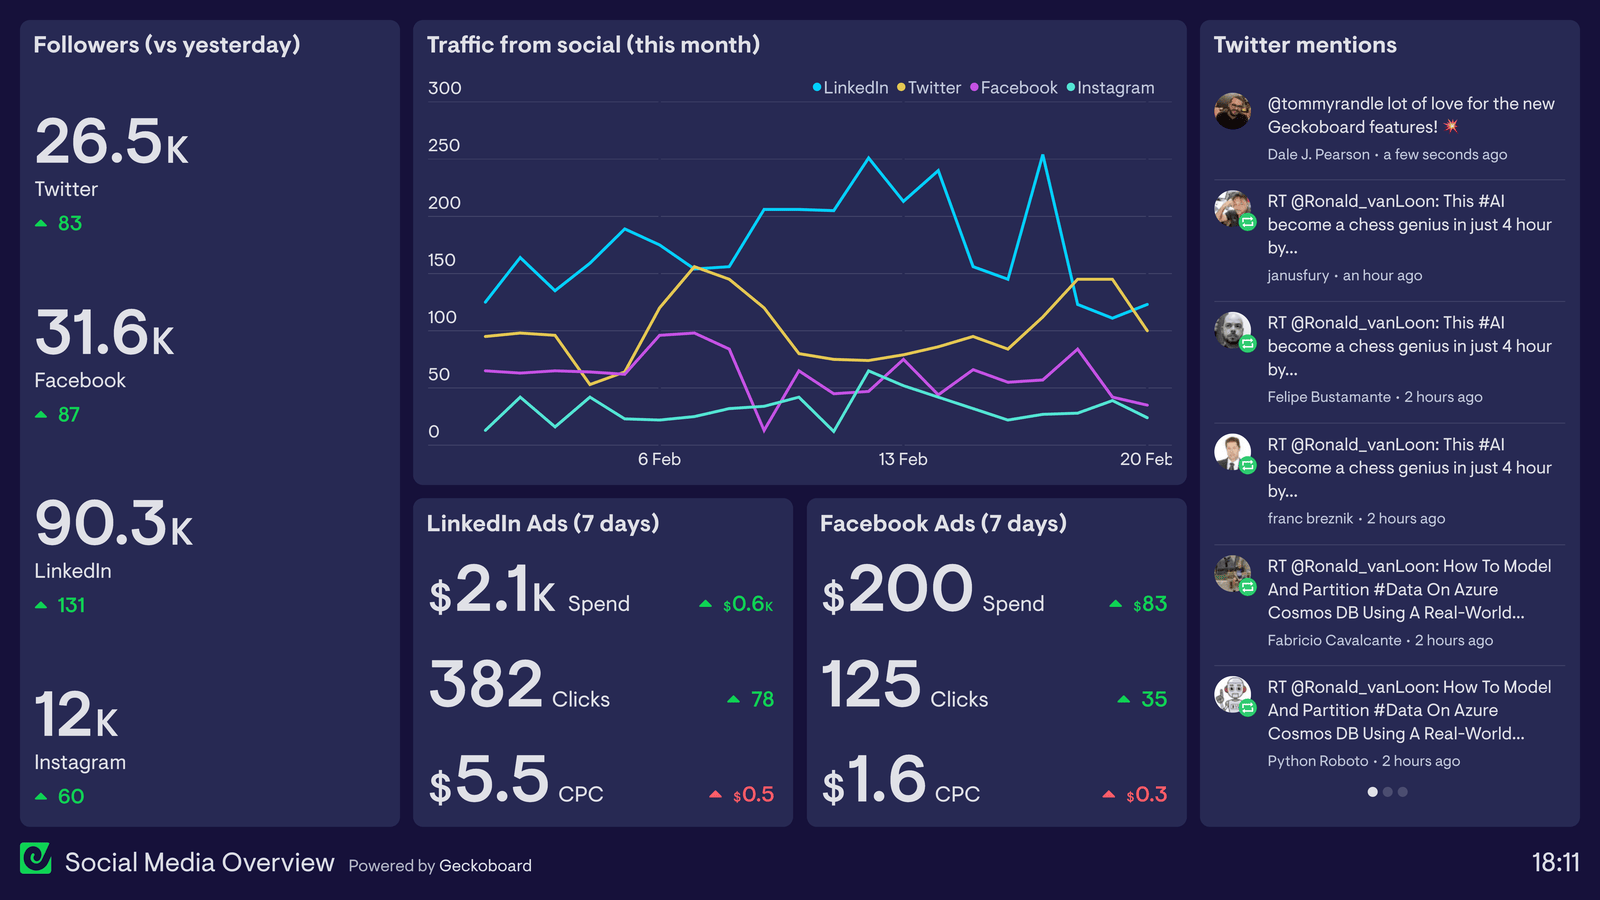
20. Build a Simple Monthly Dashboard
A small business dashboard can fit on one page.
Include these sections
- Total content published
- Reach by platform
- Top five posts
- Website clicks
- Leads or sales
- Best content pillar
- Best format
- Key customer questions
- Actions for next month
A dashboard should end with decisions, not only charts.
21. Use Percentage Change Carefully
A 100% increase can sound huge, but going from one lead to two leads is still only one extra lead. Always show the actual numbers.
Likewise, a small percentage change on a large base can be meaningful. Context matters.
22. Avoid Comparing Different Time Periods
Compare the same number of days. Be aware of holidays, promotions, and seasonal demand.
If one month had a major product launch, do not expect a normal month to match its reach.
23. Separate Organic and Paid Results
Paid promotion can inflate reach and engagement. Keep paid and organic reporting separate first, then review their combined contribution.
This shows whether organic content is improving on its own.
24. Use Platform-Specific Metrics
Each platform has unique features. TikTok and YouTube may offer detailed watch metrics. Pinterest may emphasize saves and outbound clicks. LinkedIn may provide professional audience data. Meta platforms may show message or page actions.
Use official documentation because definitions and available reports can change.
25. Create a Weekly 15-Minute Check
A weekly review should be fast.
- Check major reach changes.
- Identify the best and weakest posts.
- Read comments and messages.
- Check website clicks.
- Note any technical or link issue.
- Do not make large strategy changes yet.
Weekly data helps you catch issues without overreacting.
26. Create a Deeper Monthly Review
- Compare the month with the prior period.
- Group results by pillar and format.
- Review website and lead outcomes.
- Check production effort.
- Identify three lessons.
- Choose three actions for next month.
Example monthly decision
You may learn that educational carousels earn the most saves, short videos create the most profile visits, and customer case posts create the most website clicks. Next month, increase those formats while reducing low-value promotional graphics.
27. Build a Metric Ladder
A metric ladder connects early signals to business outcomes.
| Stage | Metric |
|---|---|
| Discovery | Reach, impressions, video starts |
| Interest | Watch time, saves, shares, profile visits |
| Traffic | Outbound clicks, landing page sessions |
| Lead | Forms, calls, messages, bookings |
| Revenue | Purchases, qualified sales, repeat orders |
This keeps reporting connected to the customer journey.
28. Common Social Analytics Mistakes
| Mistake | Better approach |
|---|---|
| Tracking every number | Choose metrics tied to the goal |
| Celebrating views without retention | Check watch quality |
| Ignoring website behavior | Track post-click actions |
| Comparing paid and organic together | Separate them first |
| Changing strategy every week | Use monthly patterns |
| Ignoring production effort | Measure content efficiency |
29. Add a Simple Data Quality Check Before Reporting
Before drawing conclusions, make sure the data is complete enough to trust. A broken link, missing UTM parameter, website outage, or tracking change can create a false performance story.
Monthly data quality checklist
- Confirm important social links still work.
- Check that UTM naming is consistent.
- Verify lead forms and booking pages are recording submissions.
- Note any days when the website or campaign was unavailable.
- Record major platform or tracking changes.
- Compare lead totals with the CRM, inbox, or booking system.
For example, if website clicks rise 40% but reported leads fall to zero, do not immediately assume the social content became worse. Test the form and analytics setup first. If the form stopped sending confirmation events, the problem is measurement rather than demand.
Annotate unusual events
Add short notes for a product launch, viral post, holiday, outage, major promotion, or paid campaign. These notes make future comparisons easier because you can explain why a month looked different.
Reliable analytics is not only about collecting numbers. It is about knowing when the numbers are comparable and when a technical or business event changed the context.
Frequently Asked Questions
What is the most important social media metric?
The most important metric is the one closest to your business goal. For lead generation, qualified inquiries matter more than likes.
How often should I review social media analytics?
Check quickly each week and run a deeper review each month. Larger campaigns may need more frequent monitoring.
Is engagement rate still useful?
Yes, when calculated consistently and used with context. Do not treat it as the only measure.
How do I track social media leads?
Use UTM links, website analytics, form source fields, booking data, CRM notes, and direct customer feedback.
Should I compare my metrics with competitors?
Use competitor data carefully because you often cannot see their full reach, spend, audience quality, or conversion data. Your own trend is more reliable.
Conclusion
Social media analytics becomes useful when every metric connects to a decision. Start with the business goal. Track reach for discovery, watch quality for video, saves and shares for utility, clicks for traffic, and leads or sales for business impact. Connect platform data to website behavior and customer outcomes.
Keep the dashboard small. Review weekly for issues and monthly for patterns. Then turn the data into a few clear actions. A small business does not need more reports. It needs better decisions.